MING and the Kindle
I’ve recently been playing with a set of technologies that are becoming known as the MING stack which consists of:
- MQTT - A pub-sub message queue/protocol
- Influx DB - A time series database
- Node-RED - A GUI tool for doing event driven programming in a web browser
- Grafana - A graphing dashboard tool
We’ve had these set up for a while in DoES Liverpool to monitor the power use of the space and of some individual devices. Julian set up a device that watches the flashes from the electricity meter and publishes messages via the Wi-Fi to an MQTT broker. Node-Red picks up on these and pushes them into an InfluxDB database. Grafana then reads the values from the databases and publishes them in graphs. We’ve also got a variety of Sonoff devices around the space that can measure the power usage of the things they’re plugged into, or turn those things off and on.
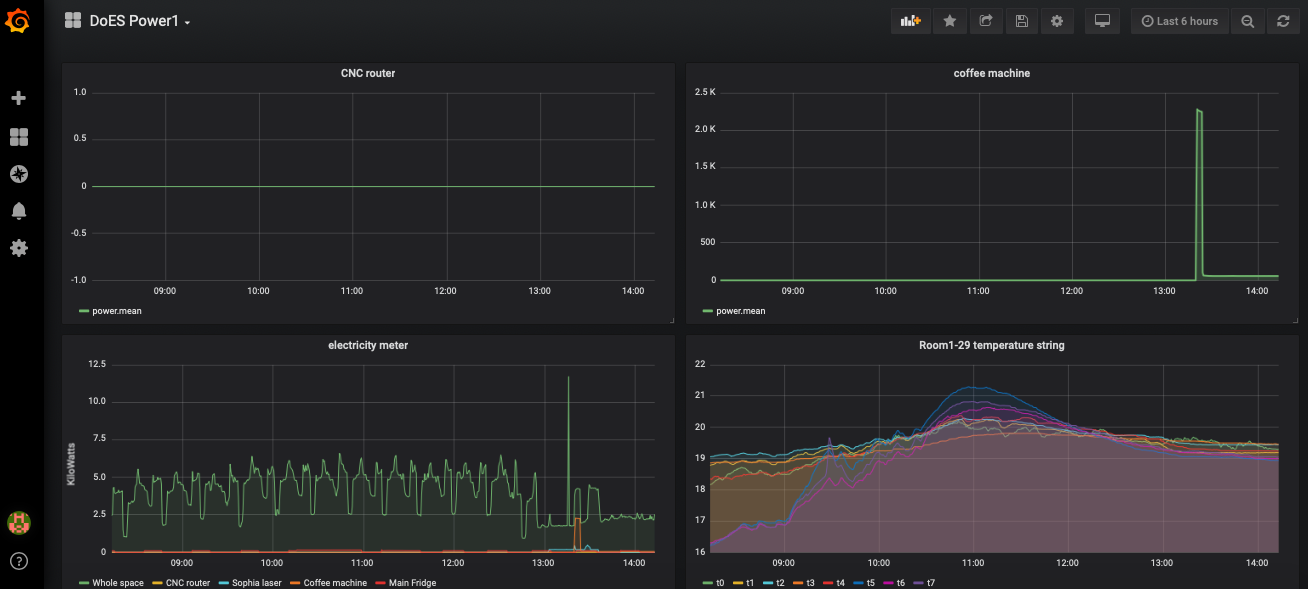
The above image shows the overall power use of the space with some individual items super-imposed, also the usage of the coffee machine. There’s also a graph showing eight separate temperatures across Room 29.
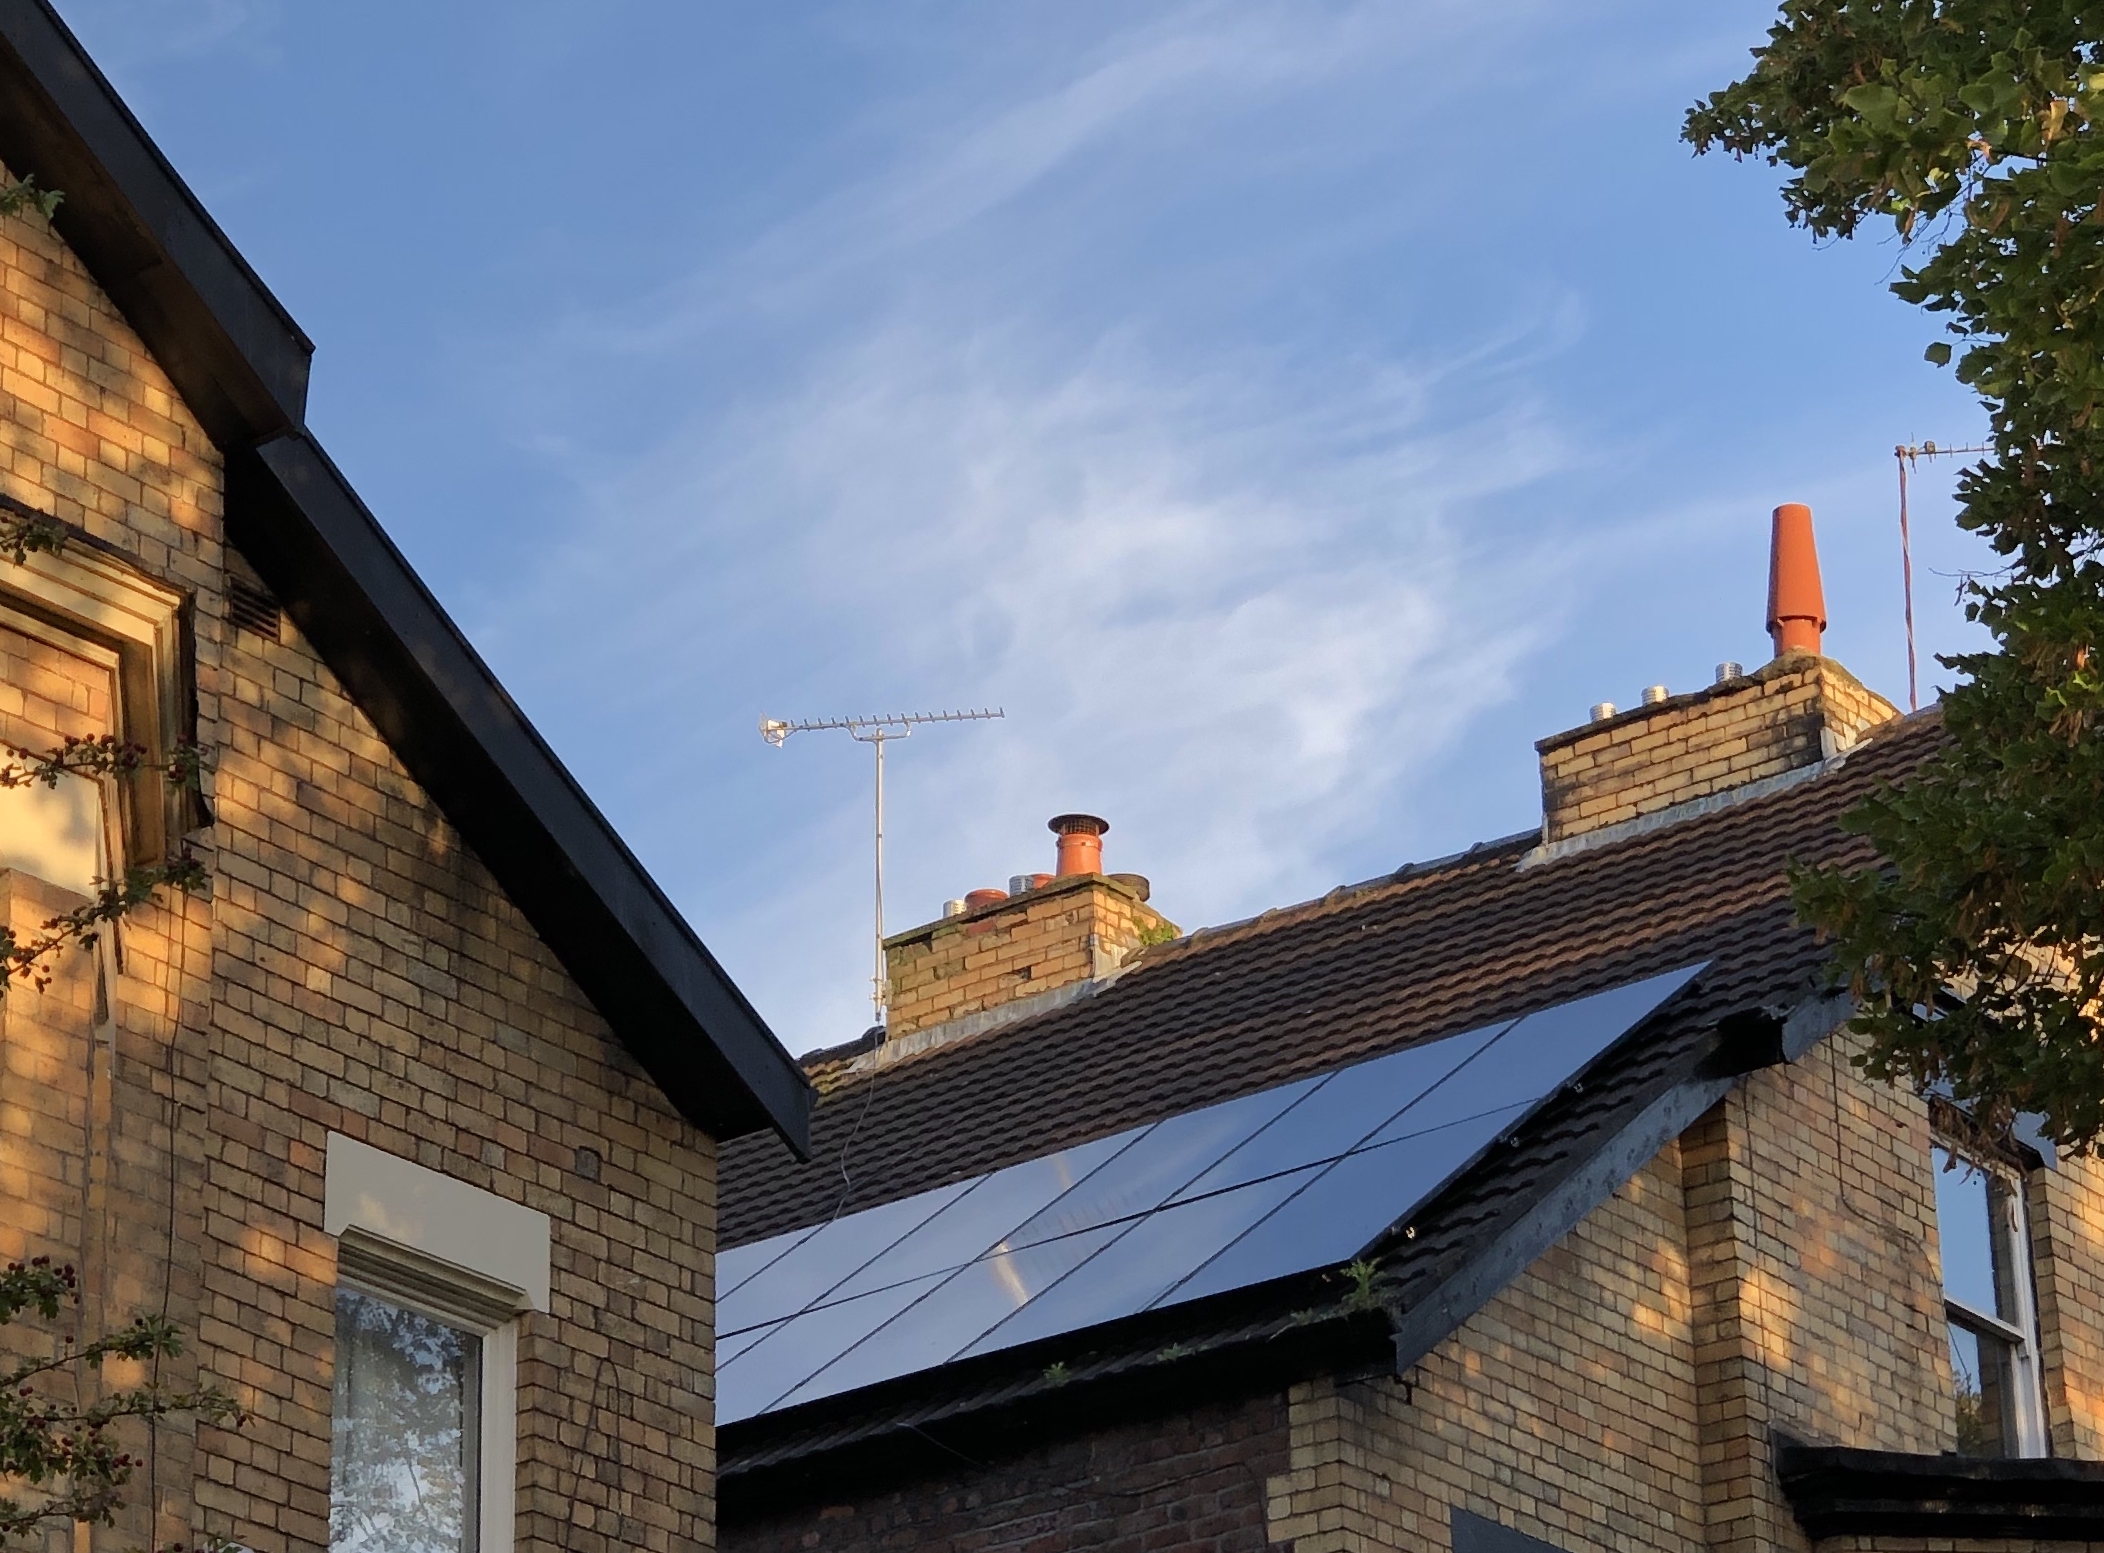
In March of this year I had solar panels and a battery installed at my home. We have an 8kW solar system and a 4.4kWh battery. These did really well over the summer and the Moixa battery system we have does give us some good graphs and data about our usage, but this is all in a cloud system and doesn’t give me much access to the data. I wanted to take control of this a bit more, so seeing the MING setup work so well in DoES Liverpool it was obvious that I needed something similar at home.
Getting things set up was a bit fiddly, in the end I found that Node-RED actually offers a script for getting Node, NPM and Node-RED properly setup on a Pi.. I think I also followed the instructions on this page to install InfluxDB but then it seems like I just used the Grafana that is available in Raspbian, so installing that would be as simple as:
Actually I used the official instructions for influxdb, I think first time around I downloaded a deb for grafana but now I’ve switched to using their apt repo
apt-get install grafana
Because our solar was installed a few months before our battery went in we were given a little Owl Intuition box that monitored our solar output and reported it on a web page. I noticed that it had some UDP settings and after some investigation found that it actually broadcasts its data on the internal network on a UDP port. This was really easy to use with Node-RED
I started writing this post a /long/ time ago. Today is 28th December 2024 so five years have passed. I’m now using PostgreSQL for the database as I had problems storing all my data in InfluxDB on a 32bit Raspberry Pi install. It’s definitely slower but has now got data for 3 years in. Apart from that the setup is somewhat the same. Apologies for not actually filling all the details in above but I’m sure it’s easy enough to find instructions on the internet now, or just ask an LLM!